
In October and November 2018 Olsztyn Municipality conducted a survey of journeys and transport behaviour of the inhabitants of the Olsztyn FUA (in the city and the neighbouring municipalities). The goal was to get credible data enabling the construction and calibration of a computer traffic model for the individual and public transport (PT) system.
Additional goals of the survey were:
- to acquire knowledge of the transport behaviour of the inhabitants of Olsztyn and the neighbouring municipalities (Barczewo, Dywity, Gietrzwald, Jonkowo, Purda and Stawiguda),
- to identify the inhabitants' transport-related needs for the purpose of studies, plans and designs concerning the development of the transport system,
- to facilitate the planning of changes in PT routes in relation to the expansion of the tram and bus network, P&R and B&R car park network and the planning of intermodal hubs,
- to facilitate the current efforts regarding the organisation of the PT.
Before the survey the Olsztyn FUA was divided into transport sectors: 33 in Olsztyn and 11 in the neighbouring municipalities.
The survey was carried out on the basis of a questionnaire consisting of such parts as:
- information on an interview, on a household and a respondent,
- travelling journals for a weekday, Saturday and Sunday – information regarding places visited by the respondent: addresses, motivation, journey start and end times, means of transport (also the number of people in a car if it was used) and the time of walking to and from the stops, reasons for choosing a car or the PT.
A journey was defined as movement by any means of transport or on foot for a distance of at least 100 m, for specific purpose (motivation) and between specific points (origin and destination of the journey).
The survey was carried out using the method of personal interviews at the respondents’ homes. The interviewers collected information by means of an application on tablets/smartphones. All persons aged 6 years and older present in a household during the interview were invited to participate in the survey (for children between 6 and 12 years old the information could be provided by a person older than 16 years).
An address sample of dwellings was drawn according to a two-stage stratified random sampling scheme (with a reserve sample). Census areas were the primary sampling units (PSU), while flats were the sampling units for the second stage. The interviewers reached 756 households in which 1511 people participated in the survey giving information about 3912 journeys.
A statistical inhabitant of the Olsztyn FUA makes on average 1,77 journey on a working day. The highest mobility characterises people aged between 6 and 15 – 1,94 journey. When analysing the surveyed group in terms of what they do, it turns out that the most mobile are employees (1,98 journey on an average working day) and pupils (1,95 journey).
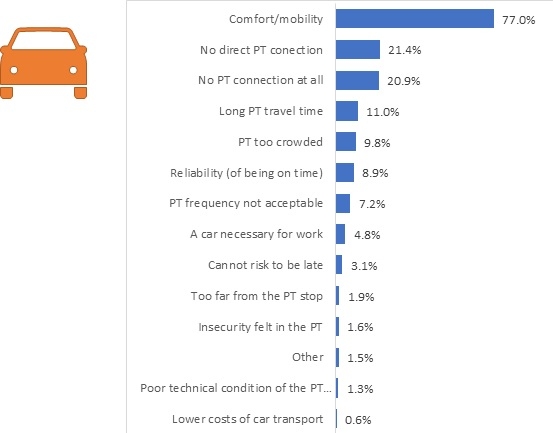
Motivations to choose a car in a journey:
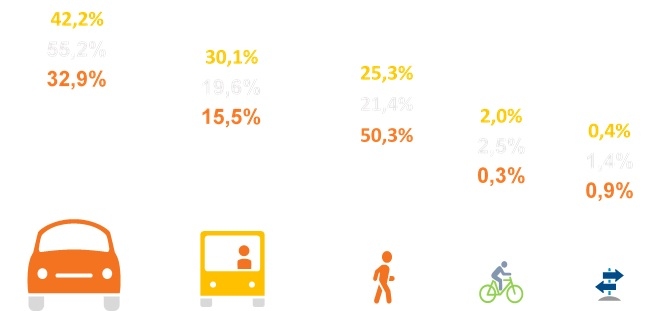
Modal split (weekdays in yellow, Saturday in grey, Sunday in red):
An average journey of an inhabitant in the Olsztyn FUA lasts 25.11 minutes. Journeys on foot, similarly to those by bicycle, last ca. 15 minutes on average. A journey by car usually takes approximately 27 minutes, whereas by public transport – 31.5 minutes.
The results of the survey demonstrate:
- About 439 500 journeys are made in the Olsztyn FUA every working day, 169 500 every Saturday and 91 700 on Sunday. Working day travellers are mainly employed people and school students while on Sunday people over 60 travel the most frequently.
- A car is the most popular transport mode – used in 40% of journeys on a working day, 55% on Saturday and 33% on Sunday. Men use them more often than women.
- One in four journeys on a working day and one in five on a Saturday are made on foot. The percentage share of journeys made on foot on Sunday reaches 50%.
- 30% of journeys on working days are made by the PT. Much less on Saturday: 20% and Sunday: 15%. Women are more likely to use the PT on general.
- The average travel times for journeys in the Olsztyn FUA depend on the transport mode. Journeys by the PT are the longest while these on foot are the shortest. What is interesting, the travel times do not depend on the day on which the journey is made.
The survey was the first one concerning journeys and transport behaviour in the Olsztyn FUA. It has enabled a description of the current situation and will serve as a basis for the assessment of effectiveness of the efforts regarding the development of the city transport system in the coming years.